

 Subscription
 Performance Subscription
 Premium Subscription
 Base Subscription
 Furniture
 Bed
Bed Kitchen
 Almirah and Wardrobe
 LCD Cabinet
 Verified Partner
 Earn Money

 AI & Data Science
 Business & Startup
 Cybersecurity & Cloud
 E-commerce & Sales
 Marketing & Growth
 Web/App Development
 AI Digital Marketing


Analytics Tips to Track Instagram Growth
Instagram analytics, If you’re trying to grow on Instagram but you’re not checking your numbers, you’re driving blind. Whether you’re a content creator, business owner, or personal brand, understanding Instagram analytics helps you figure out what’s working and what’s not.
Let’s break this down in simple terms — no jargon, just clear steps and real examples.
What Are Instagram Analytics?
Instagram Analytics are the numbers and stats that show how your content is performing. These numbers help you understand things like:
- How many people are seeing your posts
- Who is engaging with them
- What type of content works best
To grow organically on Instagram, checking these numbers regularly is a must. You don’t need to be a data expert. You just need to know what to look at.
You can also explore Instagram Funnel for Business Owners to see how analytics help move people from followers to buyers.
Free Analytics Tools You Can Use
Instagram gives you a lot of free data directly inside the app — but there are also other tools to help you go deeper. Here are some of the best:
| Tool | What It Tracks | Free/Paid |
|---|---|---|
| Instagram Insights | Followers, Reach, Engagement | Free |
| Meta Business Suite | Audience Growth, Ad Performance | Free |
| Later | Hashtag Analytics, Best Time to Post | Freemium |
| Not Just Analytics | Influencer Check, Follower Health | Free |
| Creator Studio | Video Performance (IGTV, Reels) | Free |
Explore more tools in our full guide: Free Tools to Grow Your Instagram
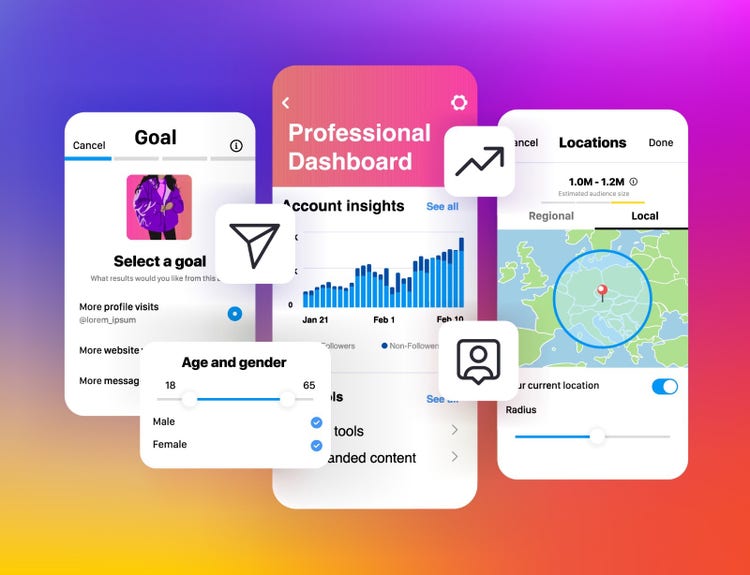
Where to Find Instagram Analytics (Step-by-Step)
You must have a business or creator account to access Instagram Insights. Here’s how to find it:
Step 1: Go to your profile
Step 2: Tap “Professional Dashboard”
Step 3: Tap “See All Insights”
From here, you can track data from the last 7, 14, or 30 days.
Metrics You Must Track
Let’s go over the top analytics you should monitor weekly:
1. Reach vs. Impressions
- Reach = number of unique users who saw your content
- Impressions = total times your content was displayed
Goal: Grow reach over time. If impressions are high but reach is low, you’re hitting the same people again and again.
2. Engagement Rate
Use this formula:
Engagement Rate (%) = (Likes + Comments + Shares + Saves) ÷ Reach × 100
| Post Type | Average Engagement Rate |
|---|---|
| Image | 1–3% |
| Carousel | 3–5% |
| Reels | 5–8% |
Check out our guide on Engagement Hacks for Small Accounts for ways to boost this.
3. Follower Growth Rate
Don’t just look at how many followers you gain. Look at how fast you’re growing. A slow, steady rise is better than random spikes.
Use this formula:
Growth Rate (%) = (New Followers ÷ Starting Follower Count) × 100
If your growth is flat, revisit Instagram Growth Mistakes to Avoid
Reels, Stories, and Posts: What Works?
| Content Type | Best For | Key Metric to Track |
|---|---|---|
| Reels | Reach, Discovery | Plays, Shares, Saves |
| Carousels | Saves, Education | Saves, Engagement Rate |
| Stories | Personal Touch | Taps Forward/Back, Exits |
| Image Posts | Branding | Likes, Comments |
Use Instagram Reels Tips for More Reach to get the most out of your videos.
Heatmap: Best Time to Post
If you’re not posting when your audience is online, you’re losing reach.
Here’s a sample heatmap of when most people engage:
| Day | Best Time to Post |
|---|---|
| Monday | 11 AM – 1 PM |
| Wednesday | 3 PM – 5 PM |
| Friday | 12 PM – 2 PM |
| Sunday | 6 PM – 8 PM |
More info here: Best Time to Post on Instagram in 2025
Story Performance Flow
Stories are underrated for conversions. Here’s a flow of what to track:
Impressions → Replies → Taps Forward → Link Clicks
- If people are exiting fast, your content isn’t engaging
- If link clicks are high, that’s a sign your call-to-action is working
Boost results by applying Instagram Stories Ideas to Boost Views
Weekly Analytics Checklist
| Task | Time Required | Frequency |
|---|---|---|
| Check overall account growth | 5 min | Weekly |
| Track top-performing post | 3 min | Weekly |
| Monitor follower growth rate | 2 min | Weekly |
| Analyze Reels & Story data | 10 min | Weekly |
| Save new caption hooks that work | 5 min | Weekly |
Steal proven ideas from Caption Hooks That Grab Attention
Use Data to Improve Content
Let’s say you find that:
- Your carousels get saved a lot
- Your Reels get shared but not saved
- Your stories have high exits after the 3rd slide
What should you do?
- Make more educational carousels
- Add call-to-actions at the end of Reels
- Keep stories to 3–5 slides max
Use your data like a GPS. Every number tells a story.
Final Tip: Always Link Back to Your Offer
Once you know what works, push people to your main offer using the funnel.
Learn the exact system inside our course:
👉 Instagram Growth Hacks Mastery
Discover more from Bukkry Multimedia and Services
Subscribe to get the latest posts sent to your email.